| No. | Item | Definition |
|---|---|---|
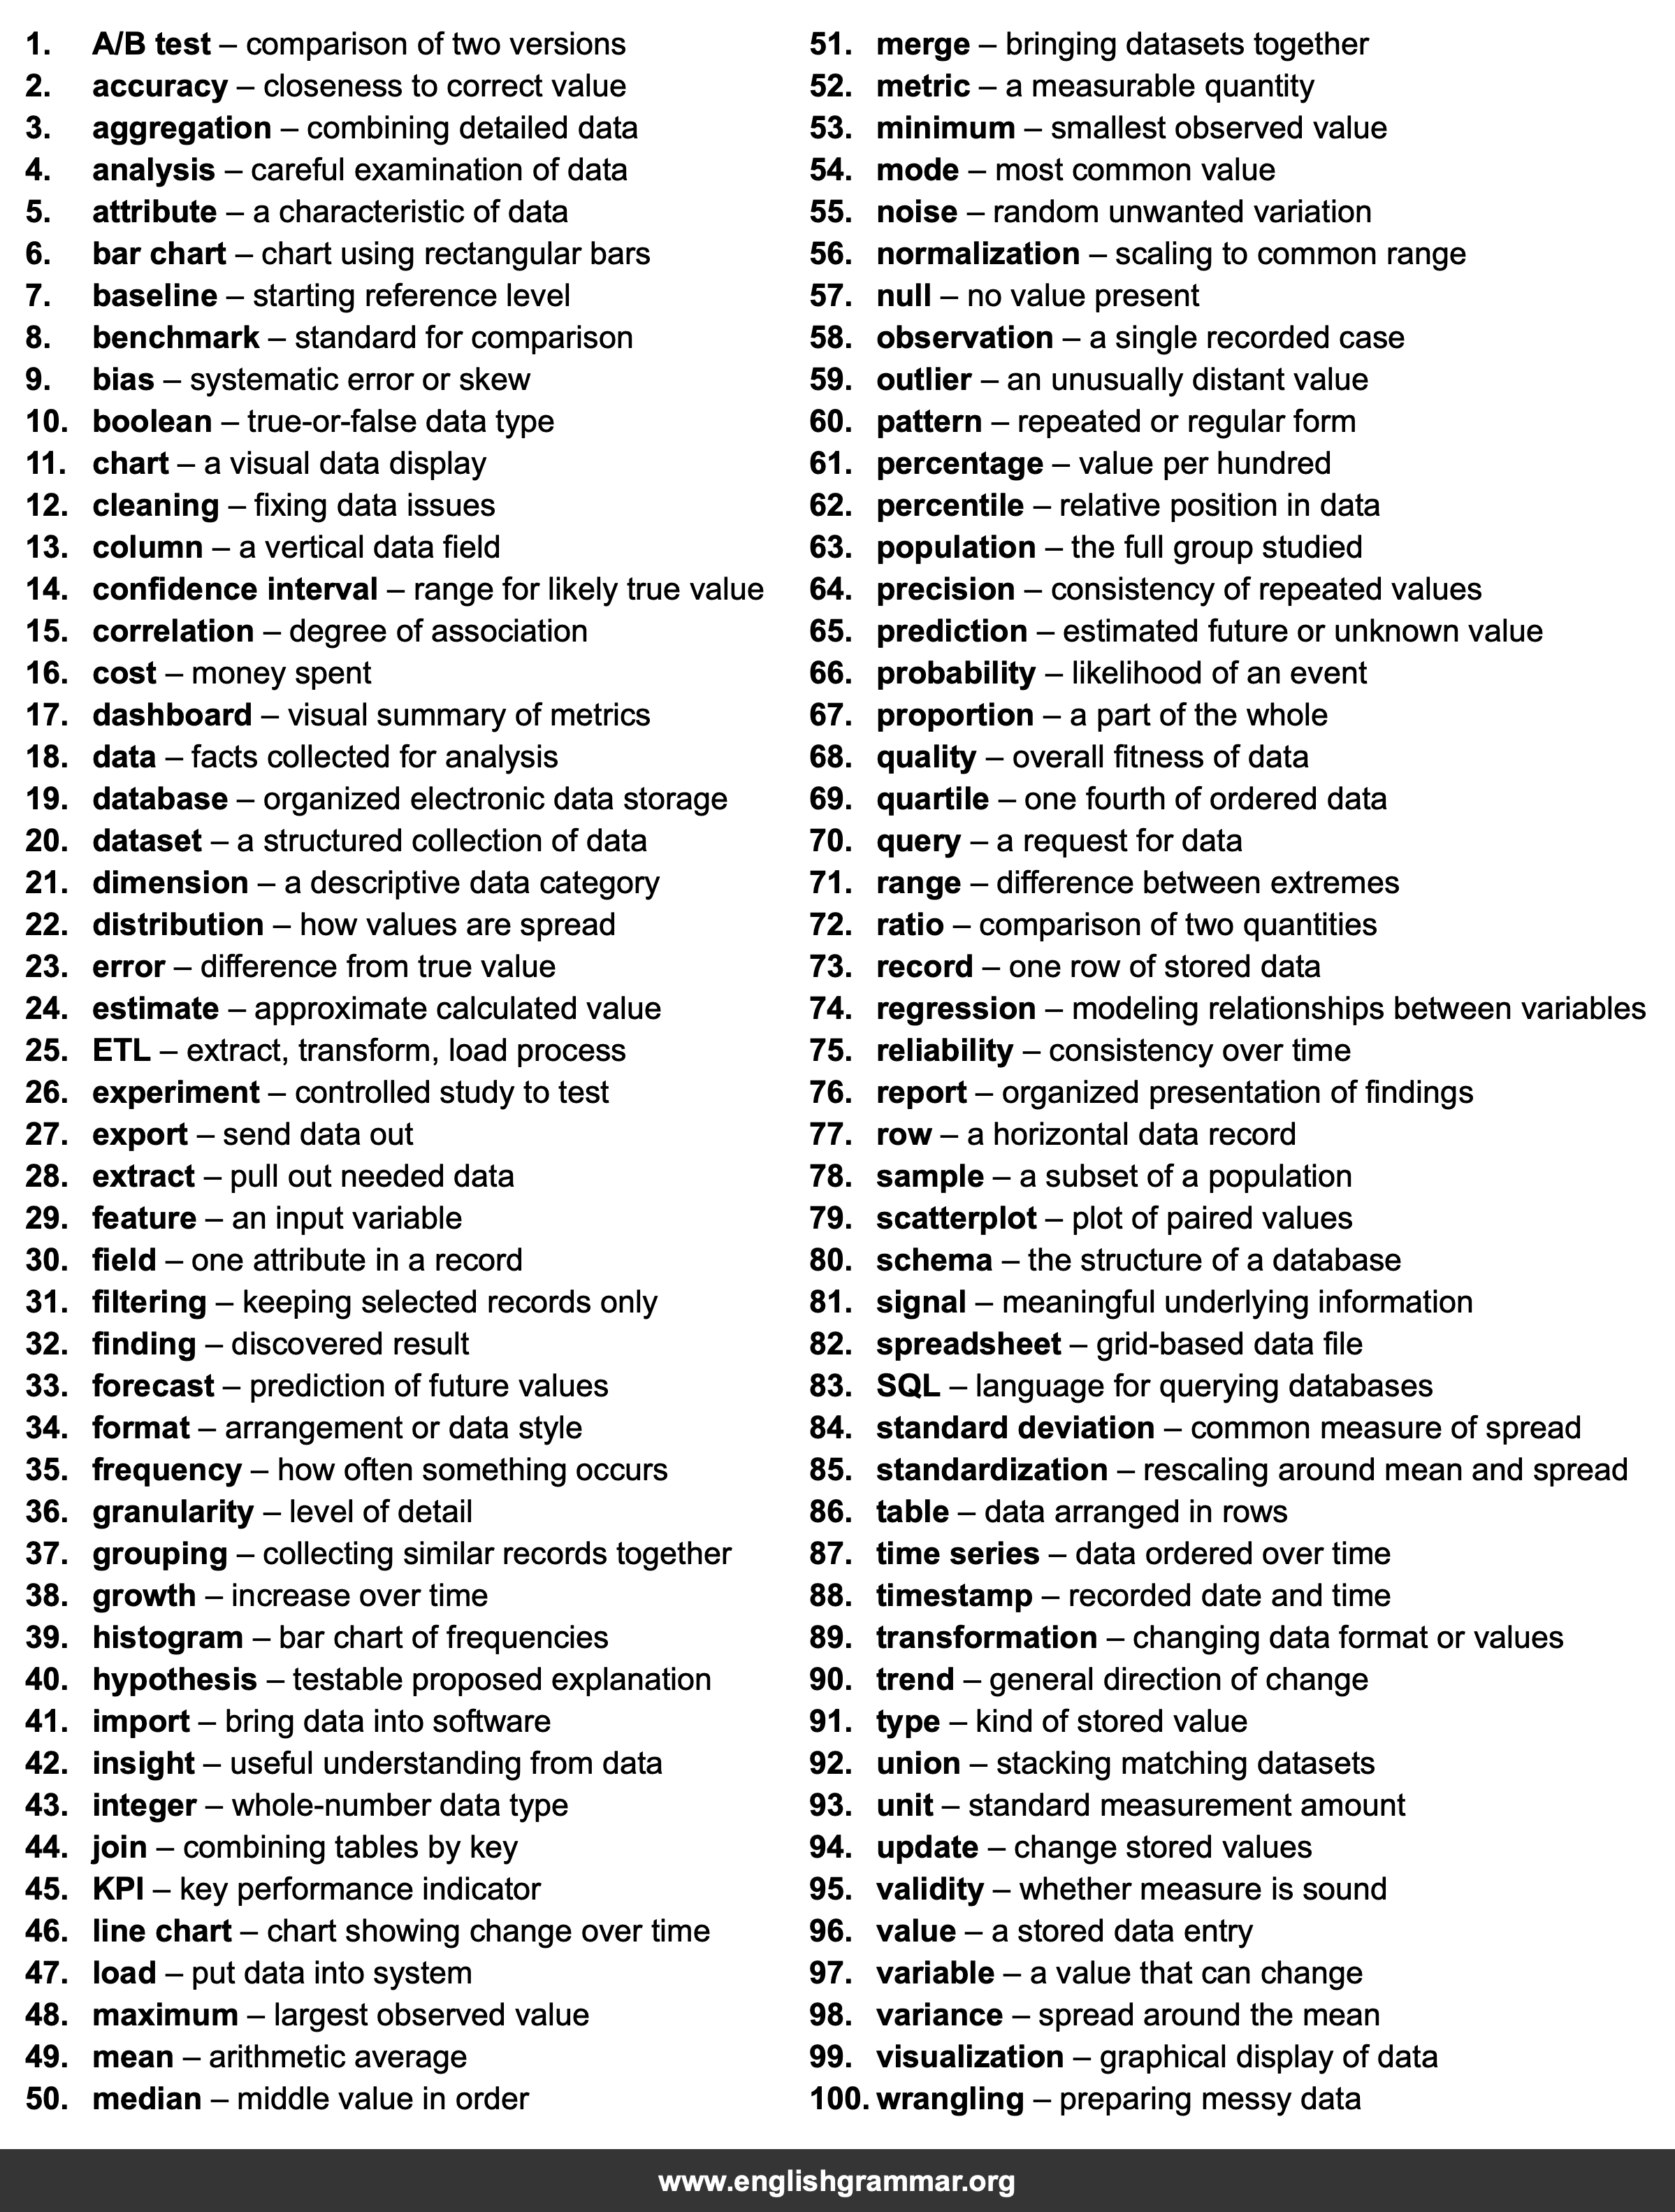
| 1. | A/B test | comparison of two versions |
| 2. | accuracy | closeness to correct value |
| 3. | aggregation | combining detailed data |
| 4. | analysis | careful examination of data |
| 5. | attribute | a characteristic of data |
| 6. | bar chart | chart using rectangular bars |
| 7. | baseline | starting reference level |
| 8. | benchmark | standard for comparison |
| 9. | bias | systematic error or skew |
| 10. | boolean | true-or-false data type |
| 11. | chart | a visual data display |
| 12. | cleaning | fixing data issues |
| 13. | column | a vertical data field |
| 14. | confidence interval | range for likely true value |
| 15. | correlation | degree of association |
| 16. | cost | money spent |
| 17. | dashboard | visual summary of metrics |
| 18. | data | facts collected for analysis |
| 19. | database | organized electronic data storage |
| 20. | dataset | a structured collection of data |
| 21. | dimension | a descriptive data category |
| 22. | distribution | how values are spread |
| 23. | error | difference from true value |
| 24. | estimate | approximate calculated value |
| 25. | ETL | extract, transform, load process |
| 26. | experiment | controlled study to test |
| 27. | export | send data out |
| 28. | extract | pull out needed data |
| 29. | feature | an input variable |
| 30. | field | one attribute in a record |
| 31. | filtering | keeping selected records only |
| 32. | finding | discovered result |
| 33. | forecast | prediction of future values |
| 34. | format | arrangement or data style |
| 35. | frequency | how often something occurs |
| 36. | granularity | level of detail |
| 37. | grouping | collecting similar records together |
| 38. | growth | increase over time |
| 39. | histogram | bar chart of frequencies |
| 40. | hypothesis | testable proposed explanation |
| 41. | import | bring data into software |
| 42. | insight | useful understanding from data |
| 43. | integer | whole-number data type |
| 44. | join | combining tables by key |
| 45. | KPI | key performance indicator |
| 46. | line chart | chart showing change over time |
| 47. | load | put data into system |
| 48. | maximum | largest observed value |
| 49. | mean | arithmetic average |
| 50. | median | middle value in order |
| 51. | merge | bringing datasets together |
| 52. | metric | a measurable quantity |
| 53. | minimum | smallest observed value |
| 54. | mode | most common value |
| 55. | noise | random unwanted variation |
| 56. | normalization | scaling to common range |
| 57. | null | no value present |
| 58. | observation | a single recorded case |
| 59. | outlier | an unusually distant value |
| 60. | pattern | repeated or regular form |
| 61. | percentage | value per hundred |
| 62. | percentile | relative position in data |
| 63. | population | the full group studied |
| 64. | precision | consistency of repeated values |
| 65. | prediction | estimated future or unknown value |
| 66. | probability | likelihood of an event |
| 67. | proportion | a part of the whole |
| 68. | quality | overall fitness of data |
| 69. | quartile | one fourth of ordered data |
| 70. | query | a request for data |
| 71. | range | difference between extremes |
| 72. | ratio | comparison of two quantities |
| 73. | record | one row of stored data |
| 74. | regression | modeling relationships between variables |
| 75. | reliability | consistency over time |
| 76. | report | organized presentation of findings |
| 77. | row | a horizontal data record |
| 78. | sample | a subset of a population |
| 79. | scatterplot | plot of paired values |
| 80. | schema | the structure of a database |
| 81. | signal | meaningful underlying information |
| 82. | spreadsheet | grid-based data file |
| 83. | SQL | language for querying databases |
| 84. | standard deviation | common measure of spread |
| 85. | standardization | rescaling around mean and spread |
| 86. | table | data arranged in rows |
| 87. | time series | data ordered over time |
| 88. | timestamp | recorded date and time |
| 89. | transformation | changing data format or values |
| 90. | trend | general direction of change |
| 91. | type | kind of stored value |
| 92. | union | stacking matching datasets |
| 93. | unit | standard measurement amount |
| 94. | update | change stored values |
| 95. | validity | whether measure is sound |
| 96. | value | a stored data entry |
| 97. | variable | a value that can change |
| 98. | variance | spread around the mean |
| 99. | visualization | graphical display of data |
| 100. | wrangling | preparing messy data |
